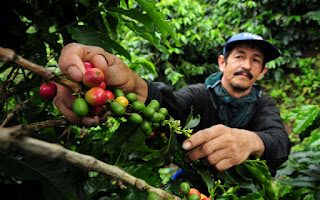
The context of climate smart coffee and cacao is in the focus of a PhD carried out by Mona Bartling (supervisor: Prof. Thomas Blaschke). The PhD topic is based on the BMZ (German Federal Ministry for Economic Cooperation and Development) funded project “Climate smart coffee and cacao: from theory to practice” (CSCC), carried out from January 2017 until December 2019. The CSCC project seeks to improve coffee farmers’ income level while increasing the coffee systems resilience against climate change by mainstreaming climate-smart adaptation and mitigation practices.
Capacity will be built throughout the sector to deliver site-specific information by using the GeoFarmer application which is based on the GeoCitizen platform. These ICT tools will be further developed and used for ‘real-time’ delivery and monitoring of Climate Smart Agriculture (CSA) package implementation, collection of feedback from all actors and in all stages of the project.
The GeoCitizen platform is the English version of the Bürgercockpit application which is being further developed by the Z_GIS spin-off Spatial Services. Therefore, the enhancement of ICT tools within this project is of use not only to the GeoFarmer application, but all derived application versions of the GeoCitizen platform.
In her PhD Mona Bartling
focuses on improving the usability of these ICT platforms by studying the
implementation of gamification elements for enabling a higher level of
participation, in particular of marginalised user groups with a low level of
digital literacy. Partnering institutes in this project are the International
Center for Tropical Agriculture (CIAT) and the International Institute of Tropical
Agriculture (IITA).
Contact: Mona Bartling
Thursday, November 30, 2017
Wednesday, November 22, 2017
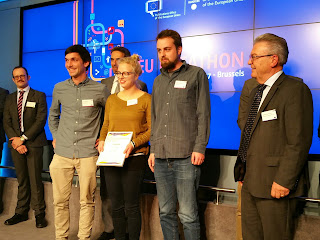
2nd place to Z_GIS graduates and team at first EU Datathon
 |
| ©2017 EU Open Data Portal |
 |
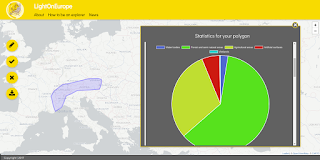
| Web application LightOnEurope |
The EU Datathon 2017 – Reusing European Union open data for jobs and growth – EU Open Data Portal Datathon was jointly organised by the Estonian Presidency of the Council of the European Union and the Publications Office of the European Union.
Presenting the LightOnEurope app, the jury emphasised the use of geospatial location to combine datasets across the borders of EU states – an approach which is familiar to the team as all three members are geographers.
More information and news on the app - including the launching date - is available on Twitter and the LightOnEurope-Website. For more information on the app take a look at the presentation and the demo video.
Contact: lightoneureope@gmx.de
Monday, November 20, 2017
GIS Day: Gaining insight into the world of Geoinformatics


 About 100 pupils and 40 teachers from a variety of high schools from Salzburg and Upper Austria attended the 2017 GIS Day event at the Z_GIS iDEAS:lab to explore geospatial technologies and applications. After an initial talk on "Location as interface – geomedia in the 21st century" by Robert Vogler a wide range of topics and tools was presented and tested by the participants: sensors and smart buildings, microsimulations, learning with geomedia and rightwing extremism and geomedia, to name just a few.
The attendees actively participated in the programme, such as a group of pupils who shared its experience with the GI Learner programme. Some teachers attended the event in the course of a teacher in-service training.
More information on GIS Day Salzburg
Contact: Robert Vogler
Friday, November 17, 2017
FamoS project: Bicycle models as a planning tool for reorganization of the transport infrastructure
 Cities are
known as complex, densely populated environments with transport infrastructure
playing a substantial role. With a new policy push to shift people’s travel
behavior to healthy mobility, improved cycling routes may positively alter the
comfort of travelers. A model of traffic flow can help city planners to
delineate spots where road rearrangement is required. By means of a simulation
approach the model can imitate disaggregated movements of a very large amount
of travelers in a spatio-temporal manner. Characteristics of a built bicycle
network and a natural environment influence the choice of every individual to
use their preferred transport mode and route within a day. Thus, dynamic
assignment of people’s daily activity schedules depends on a combination of
their personal attributes, along with environmental conditions and
interactions. These assumptions in transport modelling are supported by an
agent-based approach, which allow unpredictable patterns to emerge.
The FFG
funded FamoS project develops such a bicycle traffic flow model for the city of
Salzburg in the GAMA-platform simulation environment, using the agent-based
modelling approach. A project partner, the Institute of Highway Engineering and
Transport Planning from the Technical University of Graz, implements a
classical 4-step transport modelling technique to develop a similar bicycle
demand model for Graz.
Contact:
Martin Loidl, Interfaculty Department of Geoinformatics - Z_GIS
Thursday, November 16, 2017
Z_GIS team awarded 3rd place at the European Copernicus Masters University Challenge
The tool aims to improve the conceptualisation, planning and feasibility assessment of earth observation (EO) projects by providing information about the suitability of data for known project specifications. Projects utilising European Sentinel satellite data can be approached more efficiently, saving time and initial planning costs. The tool will also aid less experienced users of EO-data towards more efficient and targeted project planning and execution.
For example, a project team might be interested in monitoring deforestation in Indonesia based on change detection using a time-series. With the tool, the users can select an area-of-interest and immediately retrieve relevant information about the frequency of acquisition, historic information of the average time between cloud-free acquisitions, etc.
Contact: Martin Sudmanns
Sunday, November 12, 2017
Excellence Award for Z_GIS' Dr.Shahnawaz
Dr. Shahnawaz has been has been honoured with the ‘Excellency Award 2017’ by the Union of Geographic Information Technologists (UGIT) established at Bangalore University, India for his contributions in enhancing geospatial education, training and research in South and Southeast Asia over last fifteen years. He is Director of UNIGIS S/E Asia at the Interfaculty Department of Geoinformatics - Z_GIS, University of Salzburg, Austria and has established cooperations for Geospatial education between Z_GIS and a number of leading universities in S/E Asia and implemented a range of cooperation activities.
Dr. A. S. Kiran Kumar, Chairman - Indian Space Research Organisation conferred the award on Dr. Shahnawaz in Bangalore during the inaugural session of the 6th UGIT’s International Conference on Climate Change and Sustainable Water Resource Management – Innovative Geospatial Solutions schedule from November 9 to 11, 2017.
Congratulations!
Subscribe to:
Posts (Atom)


